December 30, 2017

A Ridgy New Year

As some of you can tell, I took a bit of a break from the blog for a week, but I am back.

The first week of the New Year promises dry conditions, no snow, no storms and moderating temperatures.

The reason?  The return of high pressure (also known as ridging) over the the West Coast.

The temperatures at Seattle during the last 3 months has had a number of swings, but overall it was a very normal fall/early winter. Note that the number of negative excursions roughly equal the positive ones--a sign of normal conditions for the period.
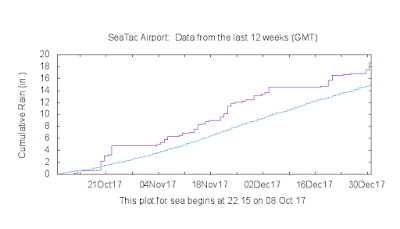
The cumulative precipitation at Seattle was wetter than normal (19 inches fell when normal was 15 inches).  Above normal, but not that anomalous.
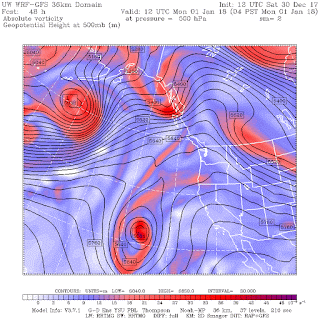
The spigot will be turned off during the next week, with high pressure producing sinking air that dries out the lower atmosphere.  The upper level (500 hPa) chart for Sunday at 4 AM shows the ridge in place.


Monday morning, the ridge is still there over the Northwesr, but with an moderate trough moving into SE Alaska.


Tuesday morning....the West Coast ridge strengthens!

But later in the week (4 PM Wednesday shown), while the ridge holds over the Northwest, a trough (with precipitation) reaches California....they can use the moisture.


Happy New Year....

December 27, 2017

The Paradox of Sea Level Rise

Sea level is rising.

There is no doubt about it.

But why?

How much of the recent rise is due to greenhouse gas warming?  How much of it is natural? 

The situation is a bit more nuanced than described by some of the media and others (like Zillow in a recent prediction of large numbers of coastal homes flooding in the NW).


Well, let's get our feet wet in this topic by examining sea level records provided by NOAA for several cities.  In each of them, NOAA has also put a "best fit" line for reference.

First Seattle, which has a sea level record going back over a century (1900).  Over the entire period, there has been an average of 2.03 mm increase in sea level per year (.67 feet per century).  The interesting thing is that the upward trend has been going on for a long time, well before the impacts of human emissions of greenhouse gases were significant.  (The radiative impacts of increasingly CO2 became large in the 1970s and later).  And rate of rise has been quite steady, with no hint of a recent acceleration.  In fact, there has been minimal rise during the past 20 years.


San Diego?   A very similar evolution, at a slightly greater rate of rise (2.15 versus 2.03 mm per year)


How about Key West?   A little more:  about 2.40 mm a year (.78 feet per century).  Again, no hint of acceleration of sea level rise during the past decades as human-emitted greenhouse gases have increased rapidly. 


From NOAA's National Climatic Data Center's website I secured this graphic of global sea level rise over the past 140 years.  Pretty steady rise since roughly 1920 and even rising before that.

Sea level can be measured with measurements at the sea surface or from satellites.  The solid line above is a satellite retrieval.  Here is a plot of satellite measurements....but only goes back to the 90s.
Pretty steady rise.


It is important to note that coastal sea level rise is not uniform around the world, with one reason being that the land is not staying at the same elevation!   In some places, the ground is sinking, due to pulling removal of subsurface water or oil, or some other natural process.  For example, the land is rising today in locations that were covered by ice-age glaciers that pushed the land surface down.  After they melted roughly 14,000 years ago, the land rebounded.  That is happening here in the Northwest, particularly for the Olympic Peninsula.

To illustrate all this, here is a a sea level trend map from NOAA.  Some places like the Olympic Peninsula has sea level going down.  Same in Alaska.  But there are large rises where the land is subsiding, such as New Orleans.


So this sea level rise business is pretty nuanced.

Sea level rise is not accelerating appreciably, even thought greenhouse gas concentrations are rapidly rise.  And the rise of sea level began more than a century ago, well before humans could have been a significant cause.    In fact, there was something called the Little Ice Age that occurred during the 1500s to middle 1800s, with subsequent warming that was mainly natural.  The current sea level rise period appears to have its origin in the demise of the Little Ice Age and the warming that followed.

So claims that all or most of the rise in sea level is due to human-emitted greenhouse gases appear problematic because it started before humans could be the main cause.  The casual link is further weakened by the lack of acceleration of sea level rise during the past few decades.

On the other hand, our climate models suggest an accelerated rise of sea level rise due to greenhouse gas warming during this century.  Will our models be correct or are they too sensitive to greenhouse gas impacts?  Time will tell.


So, what sea level rise should we expect in Seattle during the remainder of the century?

Extrapolating the current, steady upward trend implies about a .6 ft rise.  If we include the impacts of greenhouse gas warming, there would be more.  A National Academy of Sciences report did such an analysis suggesting a 4-56 inch increase by 2100, with a mean change of 30 inches (2.5 ft).  But whether such model-driven estimates are reliable is uncertain:  I suspect it will be on the high side considering the slow rise of the past few decades.


December 25, 2017

Inversion Truth: How Unusual Have They Been?

During the past few weeks, we have had several periods of strong temperature inversions over the lower atmosphere of our region.   Were they unusual or record breaking?

This blog will take on this important question!


A temperature inversion occurs when temperature increases with height, which is the opposite of the normal situation in which temperature declines with height in the lower layers of the atmosphere.

Here is a of temperature and humidity with height at Quillayute, on the WA central cost for 4 AM on Dec. 11.  The right line is temperature and the left is dew point.  The y axis is height in pressure (700 is about 10,000 ft, 850 about 5000 ft)


There is one strong inversion at this time, with temperature going from -3C at the surface to 17C a few thousand feet up:  a 20C or a 36F increase in temperature.

Imagine what it was like climbing a modest peak that day?  Below freezing at the surface and around 60F when you got to the top?

But is this the record inversion ever observed here?  Let find out using Quillayute data for the evaluation.  This location is the closest vertical sounding location to most of the Puget Sound region and provides insights into the air moving in off the Pacific.

UW Atmospheric Sciences graduate student Joe Zagrodnik ran the numbers and let me show you what he found.  He looked at 13,949 12Z Quillayute soundings from 1979-present.

First, here are the TOP FIVE inversions at the coast

1. December 25, 1985, 23.3 C
2. January 17, 2009, 22.7 C
3. December 26, 1999, 19.9 C
4. December 24, 1985, 19.1 C
5. January 15, 2009, 19.1 C

Our super-inversion last week is not even on the list, with the big winter being December 25, 1985.  Note that the big inversions like the mid-winter period:  December and January.

But Joe did not stop there.  Here is the frequency of inversions of varying intensity (10C or more rise in the lower few thousand feet).  There are lot more moderate inversions than strong one, with a sharp drop off in frequency for the more extreme events.

Now take a look at the frequency of strong inversions (great than 15C increase with height in the lower few thousand feet) by month.  December, January and October lead the pack, but there are some even in the summer.   March and April had none!

Looking at more moderate inversions (stronger than 10C), late summer and early fall are the top months)
 So how do we explain all this?

During the summer and fall, we can get a decent inversion when cool marine air from off the Pacific ocean undercuts warmer air above.  And the air above is still quite warm well into the fall.

But to get the super-inversion, we need something that warm the atmosphere aloft and greatly cool the surface air layer. 

You can do this with a strong ridge of high pressure overhead.  

There is sinking air in highs, with the sinking producing warming by compression (air goes from low to high pressure).  Think of your bicycle pump.  And warm air moves in from the south on the western side of highs.

 The sinking aloft kills clouds, which allows the surface to radiate heat into space through infrared radiation emission.  And highs have relatively weak winds, so there is not a lot of mixing of warm air down to the surface.  So high pressure areas are inversion machines!

And there is something else.  Snow. The strongest inversions often occur during periods with snow on the ground, since snow reflects solar heating but emits like mad in the infrared.

Finally, why do we care about inversions? 

Because they are associated with great vertical stability in the atmosphere, greatly weakening vertical mixing. As a result, air quality declines with inversions, cold air stays entrenched near the surface, and fog often develops (which is bad for aviation and road travel).


December 22, 2017

A Fairly Normal Fall

We have had some warm periods and some cool ones.   Some wet periods and some dry ones. 

But looking at the entire fall, everywhere came out in the wash, leaving us with a fairly typical fall.

As we will see there is an important message in all this:  the weather on a particular day is often not "normal" but that is itself "normal", with mean conditions for a particularly date averaged over above-normal and below-normal gyrations of past years.

Consider temperatures during the past 12 weeks at Seattle-Tacoma Airport (below).  The purple and blue lines show the average maximum and minimum temperatures, respectively.   We had some warmer than normal periods, but almost the same number of below-normal ones.   This is what a normal fall looks like temperature-wise.
Did we approach or exceed some daily temperature records?   Yes, as shown below, with purple dots being the daily high and the blue dots the daily low records for Seattle-Tacoma Airport.  Sea Tac achieved a daily high record in early November and tied some low records earlier in the period. 
Keep in mind that it is normal to break some daily records...we do this all the time. 

Why is it normal?  Because there is a certain amount of random variability in the weather/climate systems and sometimes the requirements for unusual events just come together naturally.

What about precipitation?  Similar points.  Below is the cumulative precipitation at Sea-Tac, with observed shown by purple and "normal" by the blue line.  This fall is ending up slightly wetter than


normal, but we got there through very wet and very dry periods.  Typical.

Let's get a better view of our fall from a spatial viewpoint.   First, the difference of average daily temperature from normal for the past 90 days (9/19 through 12/17).  The entire NW is close to normal (light green or yellow, or different from normal by less than 2F).   Portions of the southwest U.S. are warmer than normal (particularly Arizona and New Mexico).


Precipitation?   Slightly wetter than normal over most of Washington and near normal over Oregon.  California is drier than normal (2-5 inches).


Bottom line: a totally unremarkable fall over the Northwest.


December 19, 2017

Snow Returns to the Northwest Mountains (and Even Some Lowlands)

With high pressure dominating our weather during the past week or so, our mountains have had a snow drought of sorts.  But all of that changes today.

A vigorous frontal system and associated low center will cross the Northwest today, bringing substantial precipitation everywhere and several feet of snow to most of the Cascades.

Let me show you some of the UW WRF model runs for the next few days.  You will be greasing your skis before I am done!

The snowfall for the 24h ending 4 AM Wednesday, shows bountiful snow (1-2 ft) over the Cascades above 4000 ft from southern BC to the CA border.  With cool air pushing through the Fraser River Valley, Bellingham and the San Juans get some white stuff as well.

 The following 24-h (4 AM Wednesday to 4 AM Thursday), shows the end of snow over WA, with light snow over the portions of Oregon.


 Here is a closer view of the 72h snowfall ending Thursday at 4 AM.  Nearly 3 ft will fall over higher terrain (remember snow depth will be less!) and the mountains surrounding the Columbia Basin will get snow as well.


After the Tuesday snowfall/precipitation event the spigot will turn off as ANOTHER ridge of high pressure develops over the eastern Pacific. Here is the upper level (500 hPa) map for 1 AM Thursday.  A ridge offshore will keep us dry.


And by Sunday morning at 8 AM, the ridge strengthens, with high pressure up and down the West Coast.   So there should be some amazing skiing for few days Thursday through Saturday at least).


One final caution.  The system today will bring windy conditions (gust above 40 mph in some locations) and the snow level should drop \ to around 500 ft Tuesday night--so snow showers are possible on hills and higher elevations.

December 17, 2017

Windy California

While the Pacific Northwest is enjoying benign, moist weather, strong winds continue to hit California.  For example, here are the maximum gusts above 35 mph) for the 24-h ending 9 AM this morning (Sunday).  A number of locations both in central/northern and southern CA hit that threshold, with several exceeding 50 mph (red colors)


Southern California is particularly impressive, with 50-70 mph gusts observed both east and west of LA.  LA itself is somewhat protected by the higher section of the San Gabriel mountains.


The latest run of the high-resolution DRI/CANSAC forecasting system shows very strong winds continuing today over southern CA (see below), with sustained winds around the Thomas fire area (between LA and Santa Barbara) getting to 35-45 mph.  Which means gusts above 50 mph.


Why the winds?  The same persistent pattern with high pressure over the intermountain west, a trough over coastal California, and an offshore pressure difference that produces strong easterly and northeasterly flow.


One good thing is that Pacific Gas and Electric is FINALLY starting to think about more effective adaptation measures, above the obvious need to clear vegetation away from their powerlines.   This week they have started to talk about pre-emptive power shutdowns to prevent electrical initial of wildfires.


And they reprogrammed their breaker system, so that it doesn't keep on trying to reenergize lines that have experienced shorts.

And now the good news for California.  Two strong troughs are going to move southward into California: one on Wednesday and one on Sunday (see below).


These disturbances will bring some serious rain to the dry Golden State. Here is the ten-day total from the NOAA/NWS GFS model.   The Northwest get quite wet (5-10 inches in our mountains of liquid water equivalent), but nearly all of CA gets some.

And it looks like the worst of the wind, will soon be over for southern CA.  A major fire event is about to end over CA.

December 15, 2017

Strange Holes in Clouds Explained

On Wednesday, I received nearly a dozen emails with pictures of strange circular holes in the cloud deck around Seattle.  Here are a few samples:

 Courtesy of Lawrence Wallman

  Courtesy of Lawrence Wallman

Courtesy of Justin Green

These strange features, known as hole-punch clouds...among other names, are caused by the penetration of aircraft through a cloud deck made of supercooled liquid water.  

Believe it or not, many middle-level clouds are below freezing but are still made  of liquid water.  Turns out that clean water can take its time to freeze when temperatures are below 0C.   

We had a cloud deck over Seattle around 3 PM Wednesday that was made up of such supercooled water.  A vertical sounding (vertical ascent from a weather balloon) at Quillayute on the WA coast at 4 PM suggested that the cloud was at roughly 450 hPa pressure or around 6600 m (22,000 ft) and a temperature around -22C (-8F).

We were dealing with an altocumulus or cirrocumulus clouds of liquid water.  A past colleague of mine, Peter Hobbs, and one of his past associates (Art Rangno) studied this situation and called the holes APIPS (Aircraft Produced Ice Particles).   Let me tell you why.

Look closely at the picture shown above (repeated below).  Do you see the fibrous looking material in the middle of the hole. Those are ice crystals! You can tell because they have a wispy, less distinct look to them.  

But what caused the transition between liquid water clouds (with much sharper edge  to ice clouds?   The passage of an aircraft!


When air goes across the wings of an aircraft the air is speed up and that causes pressure to fall on the upper side of the wing (that is what keeps a plane in the air!).  When air parcels experience lower pressure they expand and cool (this is called adiabatic cooling).  

Now clouds can be comprised of liquid water at -10C to around -22C, but if temperatures drop further, it is harder to remain liquid.  Also air can become saturated when it cools on the air frame and go directly to ice if the air is cold enough (-30C to -40C).


It turns out that ice and liquid water find it difficult to be in the same environment, water vapor leaves the liquid water and heads over to the ice crystals (this is often called the Bergeron process).  The ice crystals grow rapidly, become heavy, and fall out of the cloud, producing the hole.  You can see that happening in the cloud picture above.

Mystery solved....

December 13, 2017

Light Rain Returns to the Pacific Northwest, California Smoke Exits the Region, as the West Coast Ridge Weakens

After over a week without rain, precipitation will soon return to the Pacific Northwest.  But not much.

Morning temperatures will warm, freezing fog will lessen super temperature inversions will fade, and the hated Southern California wildfire smoke will leave our region for good.  But the ridge of high pressure is not done with us, continuing in a weakened form.

Today and Thursday should be dry, but by Friday, the probability of precipitation will increase---withe light rain Friday, Saturday, and into next week.

Let's look at the forecast upper level maps.  One valid at 4 PM today shows a ridge (high pressure) over us...and you can see the weak upper level disturbance (trough) over Idaho that brought some clouds yesterday.


The map for Friday at 10 AM shows a modest upper level disturbance passing through, depressing the ridge.  Clouds and perhaps some light showers.

But fast forward to Sunday afternoon at 1 PM.  The ridge is still there, but pushed southwards, and we are in the northern portion of it, with strong flow going into northern BC.  

Meteorologists call this a dirty ridge.  No...nothing to do with porn, but a ridge that allows some clouds and perhaps some light rain.  But no real weather.


The 72-h precipitation total ending 4 PM Friday shows unremarkable precipitation over Washington and Oregon.  Even the north Cascades only gets a few tenths of an inch.


The next 72hr?    Pretty much the same story.


Snow in the mountains?  You don't want to know about it.  Not much during the next week.  Best bet is north, up at Mt. Baker and Whistler.

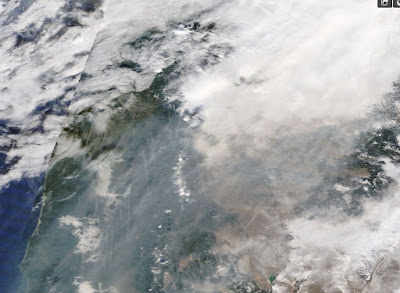
Finally, the smoke issue.  Yesterday, a lot of California smoke reached the Northwest (see midday image from the NASA MODIS satellite below)


Here is a close up view centered on Oregon.   Yuk.   Look closely...do you see a lot of fine lines?  Those are aircraft contrails.  You can also see the darkening effect of the smoke over the low clouds of eastern Washington.


The forecast models are moving he smoke out and it should stay out for the rest of the season.    A California import we don't need.


Should I Let AI Write My Blogs?

I spend a lot of time thinking about and writing my blogs.   Could AI apps do the work for me?   Could any of you tell the difference? Well,...