April 29, 2018

Kauai Experiences the U.S. 24-h Precipitation Record: Why Did it Happen?

Heavy precipitation on Kauai was headline news two weeks ago, with flooding and substantial damage on the north side of that mountainous island (something I briefly described here). 

But additional precipitation records have become available and it now appears that the precipitation in some locations went beyond extraordinary, producing 24-h amounts that have never been documented anywhere in the U.S. at any time:  the all-time 24-h precipitation record of the United States.

That is something amazing.


This week the National Weather Service released a special statement that a rain gauge in Waipa, about a mile west of Hanalei, on the north side of Kauai, received 49.69 inches during the 24 hours ending 12:45 PM HST on Saturday April 15th (that is 2145 UTC/GMT).  As an aside, the message was written by Kevin Kodama, the NWS Service Hydrologist in Honolulu, and a graduate of the UW Atmospheric Sciences department).


An official review team will evaluate the quality and consistency of the rain gauge data to determine whether the record was actually broken.   This was not an official NOAA rain gauge but one installed by the Waipa Foundation.   If true, the April 14-15th total would smash the previous U.S. 24-h record of 43 inches observed in Alvin, Texas on July 25-26, 1979.

There were a number of other extremely heavy rainfall observations in the area, so it is possible that this value is valid.   For example, the nearest station I could find as a weatherunderground.com site in Hanelei (KHIHANAL2, see map).


 On April 14th, this location received 23.05 inches, with 21 inches of it after 12:45 PM.

On April 15th, that site observed  20.43 inches in less than 4.5 hours before their power failed at 4:24 AM (see below).

This is incredible.  An average of 4.6 inches per hour.

 But it is more incredible than that....here is a plot of the precipitation that morning at that location, showing both cumulative rain and inches per hour.  About half of that rain occurred over 1.5 hours with intensities approaching 10 inches per hour.


So adding up the precipitation at that site from 12:45 HST April 14th to the time of failure (4:24 AM April 15th) gives 41.43 inches... and the event was not over.   The 49.69 inches a mile west at Waipa sound pretty believable  considering the Hanalei observations.

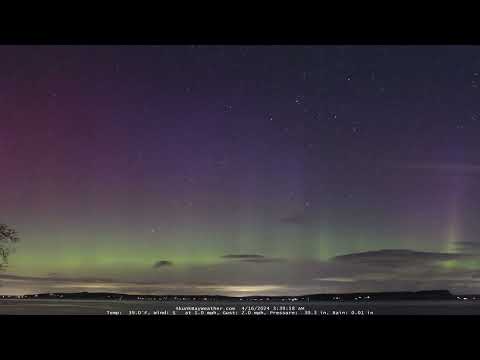
And what happened on the ground makes these huge totals believable.  Here is a video of a pass by a Coast Guard helicopter over the heavy precipitation area.  This area got hit very, very hard.


But the question that you are asking is why?   What conditions produced such amazing rainfall on the north side of Kauai?   I love exploring a meteorological mystery--so let's tear this situation apart and find out what happened.

First,  consider the location of the rain gauge, in the town of Waipa.  As shown by the map, this location is near the north coast of Kauai-- very near but upstream of the substantial terrain of the island.  Essentially, an area where major terrain extends practically to the coast line.


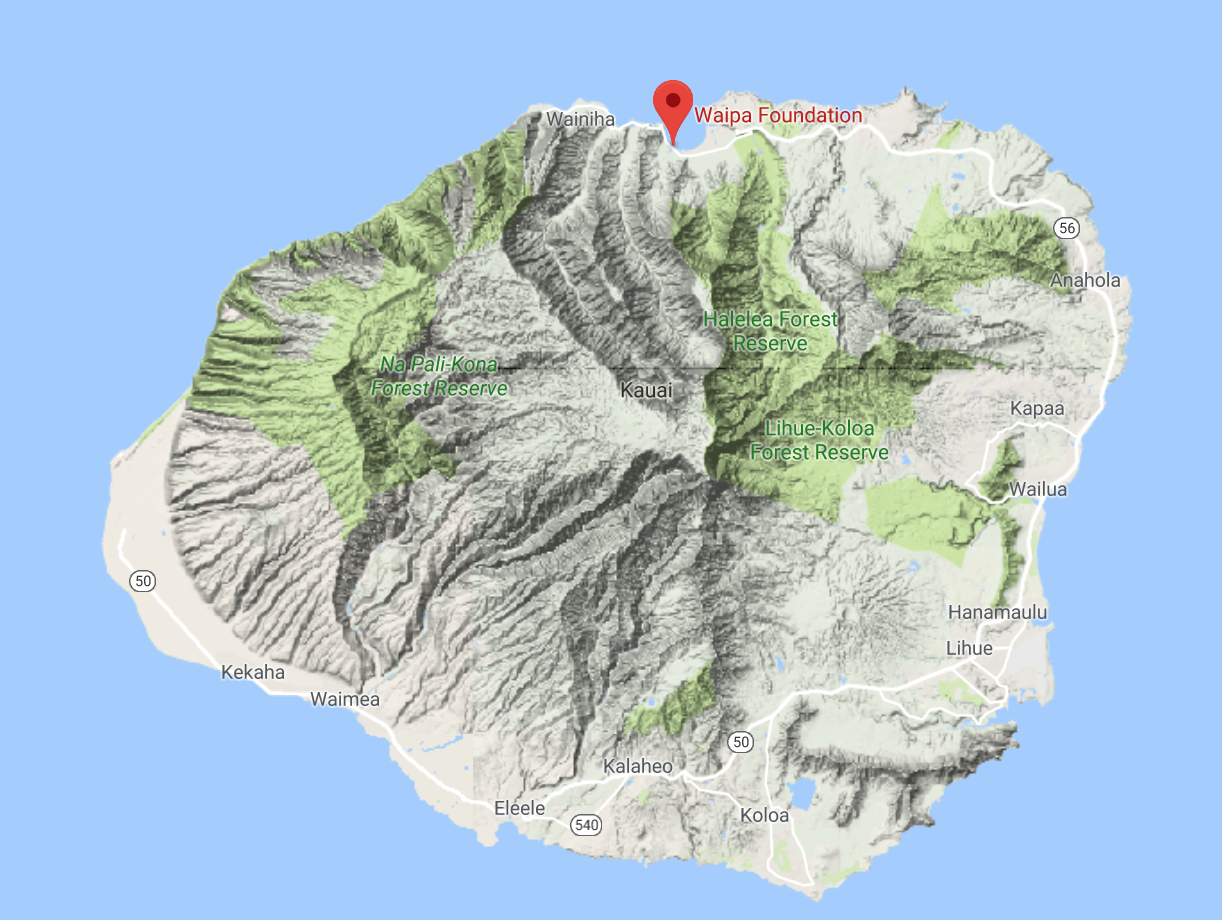
Since terrain enhancement may be an important element of this event, let's zoom in and look at the neighborhood carefully.  The location in question is about a mile west of the famous town of Hanalei.  The proximity to the terrain is probably very important...more on that later.


Just to get our bearings... the 24h period of interest is 12:45 HST  (2145 UTC) April 14 to 12:45  (2145 UTC) HST April 15th.

A key element of this event was strong easterly flow in which there were intense and persistent thunderstorm (convective) activity.   The easterly flow is also known as the trades (or trade winds), with some folks referring to this event as "thundertrades". 

The University of Washington WWLLN lightning detection network, run by Professor Robert Holzworth, documented the lightning strikes during the event.  Here is graphic he shared with me of the strikes during the period of this event (below).

Just stunning.  A huge collection of lightning strikes over the northern and northeast side of Kauai (over 3000 of them).


Lightning observations and surface reports documented hour and after hour of heavy thunderstorms over that region?  Why?

To start with, there was strong, moist, unstable trade winds approaching northern Kauai. An excellent way to see this is to look at the analyses and forecasts of the NOAA/NWS High Resolution Rapid Refresh (HRRR) for Hawaii (HRRR-Hawaii).  Here are winds analyzed at 80 m (about 260 ft) at four times bracketing the event (1800 UTC 14 April and 0000, 0600 and 1200 UTC 15 December).  You will notice that during the central portion of the event, moderate northeasterly flow impacted the northern portion of Kauai, with air forced upward by the terrain.


There is upper air (radiosonde, balloon launched with observations) at Lihue, on the eastern side of the island.  Here are plots of temperature (right line), dew point (left line) and winds at 0000 and 1200 UTC 15 April. The x-axis is temperature (C) and the y-axis is height in pressure (700 is above 10,000 ft, 850 is 5000 ft).

At 0000 UTC 15 April, there was a 5000 ft layer of saturated or near-saturated air with easterly/northeasterly flow.  This air was characterized by low stability, which means that instability (convection/thunderstorms) would have a tendency to be released as the air was forced to rise. The moist layer deepened by 1200 UTC 15 April, with substantial wind shear in the lowest 10,000 ft.


A significant upper level feature--an upper level trough--extended over Kauai during this event. This is shown by the upper level height anomaly for 500 hPa (about 18,000 ft) shown below.  The blue and purple colors show areas where heights and pressures are much lower than normal.  Troughs aloft are associated with upward motion and cool air in the lower portion of the atmosphere.
 This upper level trough helped bring large (but not record-breaking) amounts of water vapor northward over the islands.  This graphic show upper-level winds and water vapor from the GOES-15 satellite.   You can see strong southerly winds aloft pushing water vapor northward aloft.


And a satellite view shows the total water vapor in a column Saturday morning--substantial values over Hawaii.


According to NESDIS (the NOAA satellite service) they had about 175% of normal water in the column...high, but not even in the top 40 water vapor events.


Thunderstorms are encouraged by increased change in temperature with height.  During this event, temperatures were unusually cold aloft, as shown by the temperature anomaly plot for 500 hPa (about 18,000 ft), shown below.  Cold anomalies are right over the islands aloft.
At the same time, temperatures were above-normal near the surface (1000 hPa), as shown below.
 As a result, there was an usually large cooling with height, and a very important measure of convective potential, the lifted index, was lower (more unstable) than normal:
So everything came together for this event.   

There were moderately strong easterly to northeasterly winds approaching the northern coast of Hawaii....this air was primed for instability, so the upstream effects of terrain caused the air to rise and convection/thunderstorms to be released.  Thunderstorms continuously developed over northern Kauai, dumping huge amounts of rain fostered by the deep moist layer approaching the island.  And the area in question was simply ideal, with high terrain extending to the coast.  But no one element was particularly extraordinary....but the sum of all of these elements were.  Sort of like six dies coming up with the same number.

The unusual combination factors came together to give us extreme precipitation, with a small enhancement by the warming of our planet, which results in the atmosphere containing more moisture (but that can't be the primary explanation of this huge event).

Our models did predict substantial rain, but nowhere as much as occurred.  Here is the 24h precipitation forecast by Hawaii HRRR for the run initialized at 1200 UTC 14 April (Friday morning).  Not great...it showed are area of 4-6 inches (which is heavy) on the north side of the island, but nothing like the big totals observed that day.  The origin of this forecast failure needs to be examined.


April 26, 2018

The Onshore Push Has Begun

It was wonderful while it lasted.   Away from the Pacific Ocean, today was the warmest since last September, with some locations experiencing the mid to upper 80s.

Here are the max temperatures today around the region (click to expand).  Around 80F near Puget Sound but zooming up to the upper 80s along the foothills of the Cascades.  But the most amazing contrasts were near the coast...with mid-50s near the water but upper 80s twenty miles away towards the east.


During the day, clouds and southerly winds pushed up the coast--a totally typical pattern with what we call an onshore or marine push.   Here are the visible satellite photos at 9  AM, 2 PM, and 6 PM.  You could see the inundation of the coast by cool, stratus-filled air.


The cool air was held at bay by offshore (easterly) flow, something illustrated by the winds above Seattle during the past 24-h (see below).  Time increases to the left and the y-axis is height.  Wind barbs (blue) and temperatures  (red) are shown.  You will notice that the easterly wind in the lower atmosphere are weakening  and they will soon turn westerly.  The marine air, associated with higher pressure, wants to surge inland.

In fact, the plot of winds and temperatures at 8 PM shows that cool, westerly flow from off the Pacific has made it to Shelton and the south Sound and also in the Strait of Juan de Fuca.  Our warmth will be gone by daybreak as cool marine air pushes in, accompanied by low clouds.


Coastal drizzle will occur tomorrow and showers should reach the interior by tomorrow evening.

Is "Weather Whiplash" Increasing In California?

This week a paper was released in Nature Climate Change by Daniel Swain and co-authors that made a bold claim:  that California is experiencing and will increasingly experience "weather whiplash" because of anthropogenic global warming. 

They define "weather whiplash" or "precipitation whiplash" as a transition from a much drier than normal year to a much wetter than normal year, such as the change that occurred between the winters of 2015-2016 and 2016-2017.


As one might expect, with such an explosive claim and graphic metaphor, the media would go wild over it.  They did.  Headlines describing the civilization-testing whiplash were found in media outlets across the world, from the front page of the LA Times to CNN and even made Dan Rather's blog.  Environmental activists website covered this revelation in depth.


But I suspect most reporters did not read the paper, and as I will describe below, this work suffers from substantial problems and claims that are at the best excessive, even using the model simulations they describe.  And the results are entirely based on model results that don't seem to match well with what has happened in the real world.

The Claims

Swain et al.'s claims of a precipitation whiplash is based only on climate model output and so is only as good as the model.  Specifically, they used a 40-member collection of forecasts (an ensemble) using the Community Earth System Model (CESM). This is a global model developed at the National Center for Atmospheric Research. I am quite familiar with CESM and have used its output in some of my own work.  It is run at approximately 1° horizontal resolution (about 111 km) and thus is unable to simulate the details of western U.S. precipitation and weather systems.

The definition of whiplash used in this paper is a bit arcane and one-sided.
Specifically, they only considered a whiplash from dry to wet conditions.  For some reason they did not think a wet to dry whiplash was important. 

Swain and colleagues looked at the distribution of precipitation in the model during a pre-industrial period (before 1850) and found the top 20% and bottom 20% precipitation years.  With those numbers they examined CESM climate simulations, encompassing most of the 20th and 21st centuries, that was driven by an aggressive (probably too aggressive) increase of greenhouse gases (RCP 8.5 in climate modeler lingo), looking for the frequency  of changes from dry (the bottom 20% before 1850) to wet (top 20% before 1850) years.  And they did this for each ensemble member and thus were able to get the change in frequencies of this one-sided whiplash as the model simulations forced by increasing greenhouse gases.

Their results are found in the figure below for some model grid boxes in southern and northern CA (they don't really specify in the paper exactly where), showing the change in frequency of dry to wet precipitation whiplash events.  A measure of the range of climate model whiplashes are shown by the purple shading (67% of the simulations are within the shaded areas and purple line shows the ensemble mean (which has been smoothed or averaged over time)).


So, what does their analysis of the models show? 

For northern California, not much.  A decline in whiplash in the 1970s, an increase from roughly 2015 to 2025, and not much change for the next 30 years.  According to their own analysis, the changes in northern CA are NOT statistically significant.  And keep in mind that most of California's reservoir capacity is in the north.

For southern CA, there is an abrupt change from reducing whiplash to a very slow steady rise starting around 1985, with the whiplash remaining quite small until mid-century.  Considering that the envelope of uncertainty encompasses zero change until around 2050, I am sure the change would NOT be statistically significant through that time.   As shown later, this evolution in southern CA does NOT compare well with observations through 2018, where there is no trend.  And in any case, southern CA has few large reservoirs and only a small amount of California agriculture.


In general, there paper shows not much change in the number of dry years but increasing wet years for the northern two thirds of the state as we proceed into the second half of the century.

What has Actually Occurred with Precipitation Whiplashes

Here is the average wet-season (November-March) precipitation for California from 1936-2018 from the NOAA/NWS Division data available from the wonderful NOAA ESRL website.   This plot and subsequent plots were made by UW Atmospheric Sciences staff member, Neal Johnson.  Why did we start in 1936?  Because the ESRL website said there were issues before 1935.

Not much trend in CA precipitation, but plenty of ups and downs---now known as whiplash, I guess.


Anyway, since this is science, let's create a WHIPLASH INDEX (WI) that is simply difference between one year's precipitation and that of the year before (shown below).  (Note, the correct pronunciation of WI is "why").   Now this is a bit different than Swain et al. whiplash plot (they showed the frequency of increases of precipitation between very dry years (bottom 20%) and wet years (top 20%).  But my index is much easier to understand and is more informative.  And my index is based on OBSERVATIONS in the REAL WORLD unlike the model-based whiplash guidance in the Swain et al. paper.

What is clearly apparent is that it is hard to find evidence of an increase in amplitude in the whiplash index based on observations.   Now, if we look at the trend of increases in precipitation (above the dashed line)--which is very similar to Swain et al's approach-- there is no evidence of increasing dry to wet years.  In fact, there are LESS of them during the past two decades...and more in the decades before.

Or look at the wet to dry transitions---no evidence of any trend.

But let's take this one step further, Swain et al. divided their whiplashes into southern and northern California.  Let's do better than that (a UW Husky will always try to improve upon a UCLA Bruin)--- let's calculate the whiplash index for southern, central, and northern California (below).

Northern CA


Central CA
Southern CA

These results are very important--they show there is NO increase in precipitation whiplash for any sub-region of California WHEN ONE LOOKS AT WHAT ACTUALLY HAPPENED.

In contrast, the model output applied in Swain et al shows that there is an increase in whiplash events starting around 1985 in southern CA and 2005 in northern CA.  The clear conclusion is that something is amiss with the model in predicting California precipitation.   And therefore, the predictions  used in this paper are suspect.

The fact that the model is not getting the year by year variability correct for California precipitation is hardly surprising.  West Coast precipitation is modulated by El Nino/La Nina and teleconnections (remote physical connections) forced by convection in the tropics.  And such low-resolution models do a poor job on tropical convection and thus will mess up the teleconnections.  I know a lot about this because I am actively working in this area.  And there is a way to fix the problem...but it takes huge computer resources.

But even if their model output was correct, I would argue that they and certainly the media are way overhyping these results.     In fact, at face value their predictions are good news for California.  According to their results, the increase of whiplash events in northern California is slight and is not significantly significant at even the low 90% significant level (more studies use 95% significance).  And most of the reservoir capacity in California is in the northern portion of the state.

They also show that there will be an increase in winter precipitation over time across most of California.   Now California (unlike Washington) has huge multi-year storage capacity, so even if their model is right and there was more year to year variability, California would be fine....they simply will store the water from the wet years.


There are a lot of other technical issues with the paper I could bring up, but the bottom line is clear:

(1) observations over the past 80 years do not show an increase in precipitation whiplash in California even though the effects of global warming have begun.
(2)  their model results are inconsistent with observed trends
(3)  even if they are right, the implications are positive, not negative.  California will have more water over time.

Now it is true that temperatures will increase and that will cause more evaporation and drying.  Sierra snowpack will decline (but the water will still be there as rain).  So California will probably want to add more reservoir capacity and waste less water (more drip irrigation, less crazy water loving crops).  They could even push water underground during wet years.  This is a solvable problem and not a existential threat. Weather whiplash will probably be the least of their problems.

This "whiplash" frenzy in the media shows a major failure mode in our conversations about global warming.  Some researchers analyze purely model results.  They don't compare the model output with observations.  They find some modest changes in the model projections and somewhat inflate the importance in their paper.  The media and certain interest groups hype up the results with big headlines.

As a result, the public is exposed to essentially incorrect information and gets turned off by another apocalyptic prediction.  And such poor communication gets in the way of properly dealing with climate change, a serious issue, in a rational, fact-based way.

April 24, 2018

The Subtleties of Warmth

For many in western Washington and Oregon, today was the warmest day of the past seven months... this was true at Sea-Tac Airport, where temperatures rose to 77F this afternoon (see plot of temperatures since 30 September...today was the warmest).
The plot of high temperatures today (Tuesday) shows some interesting contrasts:  mid-50s near the water.  70s over land around Puget Sound, and 80s near the coast and in the warm Willamette Valley.


Why so warm along the coast?  Because there was strong easterly flow aloft.  This is shown by a plot of winds over time above Sea-Tac Airport (red are temperatures, blue are wind barbs, time is in UTC/GMT with 24/18 indicating 11 AM this morning, the y-axis is height in pressure with 850 being about 5000 ft)  Strong easterly flow developed in the lower atmosphere last night and this morning.
Easterly flow pushes the cool marine influence offshore and produces downslope warming on the west side of terrain (like the Cascades and coastal mountains).  The coast enjoys the downslope warming benefits of two mountain barriers and thus gets very warm.

Another interesting oddity is the minimum temperatures this morning.  72F near Black Diamond in the eastern foothills of the Cascades and 60s nearby.  Why so warm?  Because of downslope warming off of nearby terrain!


 Tomorrow will be warm, but not as warm as today.  Why?   Because the easterly flow has weakened and remain weaker on Wednesday.  The sea level pressure forecast for 2 PM tomorrow shows a thermal trough of low pressure extending into southwest Washington and less east-west pressure difference than today.  Such a pattern tends to give us more northerly than easterly flow over the Sound...thus, a cooler pattern.

Thursday at the same time, the trough has pushed northward to Bellingham and the flow is more easterly over the Cascades--thus I expect warmer conditions (upper 70s that afternoon around Seattle).  But the end of warmth will be upon us soon.   With the approach of a low offshore, a ridge of high pressure builds along the coast and a strong coastal pressure gradient is building.


The result will be an onshore push of marine air late Thursday/early Friday, with considerable cooling on Friday.

So enjoy the next two days....precipitation and cooler temperatures are in store for the weekend.
_______________________________________

Announcement:  The Northwest Weather Workshop is on April 27-28
LAST DAY TO REGISTER
The NW Weather Workshop is the big annual meeting for those interested in Northwest meteorology.  This year we will have a major session on the meteorology of NW wildfires and others on other aspects of our regional weather.  The gathering takes place at the NOAA facility in Seattle.  To view the agenda and to register, go to the meeting website.  The workshop is open to everyone, but registration is required.


April 22, 2018

The Upcoming Heat Wave in the Pacific Northwest

During most years there is what I call a mid-spring heat wave, typically between mid-April through mid-May.

And we are going enjoy such a heat wave this week.  But why a mid-spring heat wave?

By mid-April, our sun is strong and the days are long....keep in mind that the sun's strength today is the same as August 20th.


But to get the heat we have to turn off our natural air conditioning...onshore flow off the cool Pacific.  And to get real warmth, some nice downslope flow down the western slopes of the Cascades, allowing air to warm by compression.

And there is a way to do this...have high pressure build to the east of the Cascades....and that is exactly what will happen this week.

The fact we often get heat waves in April and May is obvious by looking at a climatological plot of extreme daily temperatures at Sea-Tac Airport (yellow line below).  Temperatures have zoomed up to 80 in April, 80s (even low 90s) during May.


At the UW we run a high-resolution ensemble of 15 forecasts to get a handle on the uncertainties in the forecast.    Here is prediction for surface air temperature from last night's run.  The black is the ensemble average...normally a very good forecast.   Nearly right-on for today (high got to 59F).  Tomorrow's model forecast bringa Sea-Tac to 70F...roughly a ten-degree hike.  And 75F on Tuesday.

Want more assurance of the warmth?  Here is the latest output of the National Weather Service Short-Range Ensemble System (SREF). 70F tomorrow, 75F on Tuesday and a bit warmer on Wednesday, although you will notice that there is increasing uncertainty (the forecasts vary more).


 You really want to enjoy the warmth before it happens?  Let me show you the surface temperature forecast maps from the UW system.

First, the forecast for 5 PM tomorrow (Monday).  68-72F in much of western Washington.  72-76F around Portland and over the western foothills of the Cascades.


Tuesday at 5 PM.  Amazing. Upper 70s from Seattle to Portland.  Even along the coast, thanks to the offshore flow.


Wednesday at 5 PM.  A bit cooler over Seattle, but much warmer around the Columbia Basin of eastern Washington.  This is a sign that the high pressure is moving eastward.


Enjoy the warmth...after a cool, wet few weeks it will be nice to experience the spring-time lushness of the Northwest under sunny skies and perfect temperatures. 

There is one problem, though....the pollen count is high right now and according to pollen.com will get higher with all this warmth (see below).   Sorry...


Should I Let AI Write My Blogs?

I spend a lot of time thinking about and writing my blogs.   Could AI apps do the work for me?   Could any of you tell the difference? Well,...